Secure Connection's SecconBox dashboard
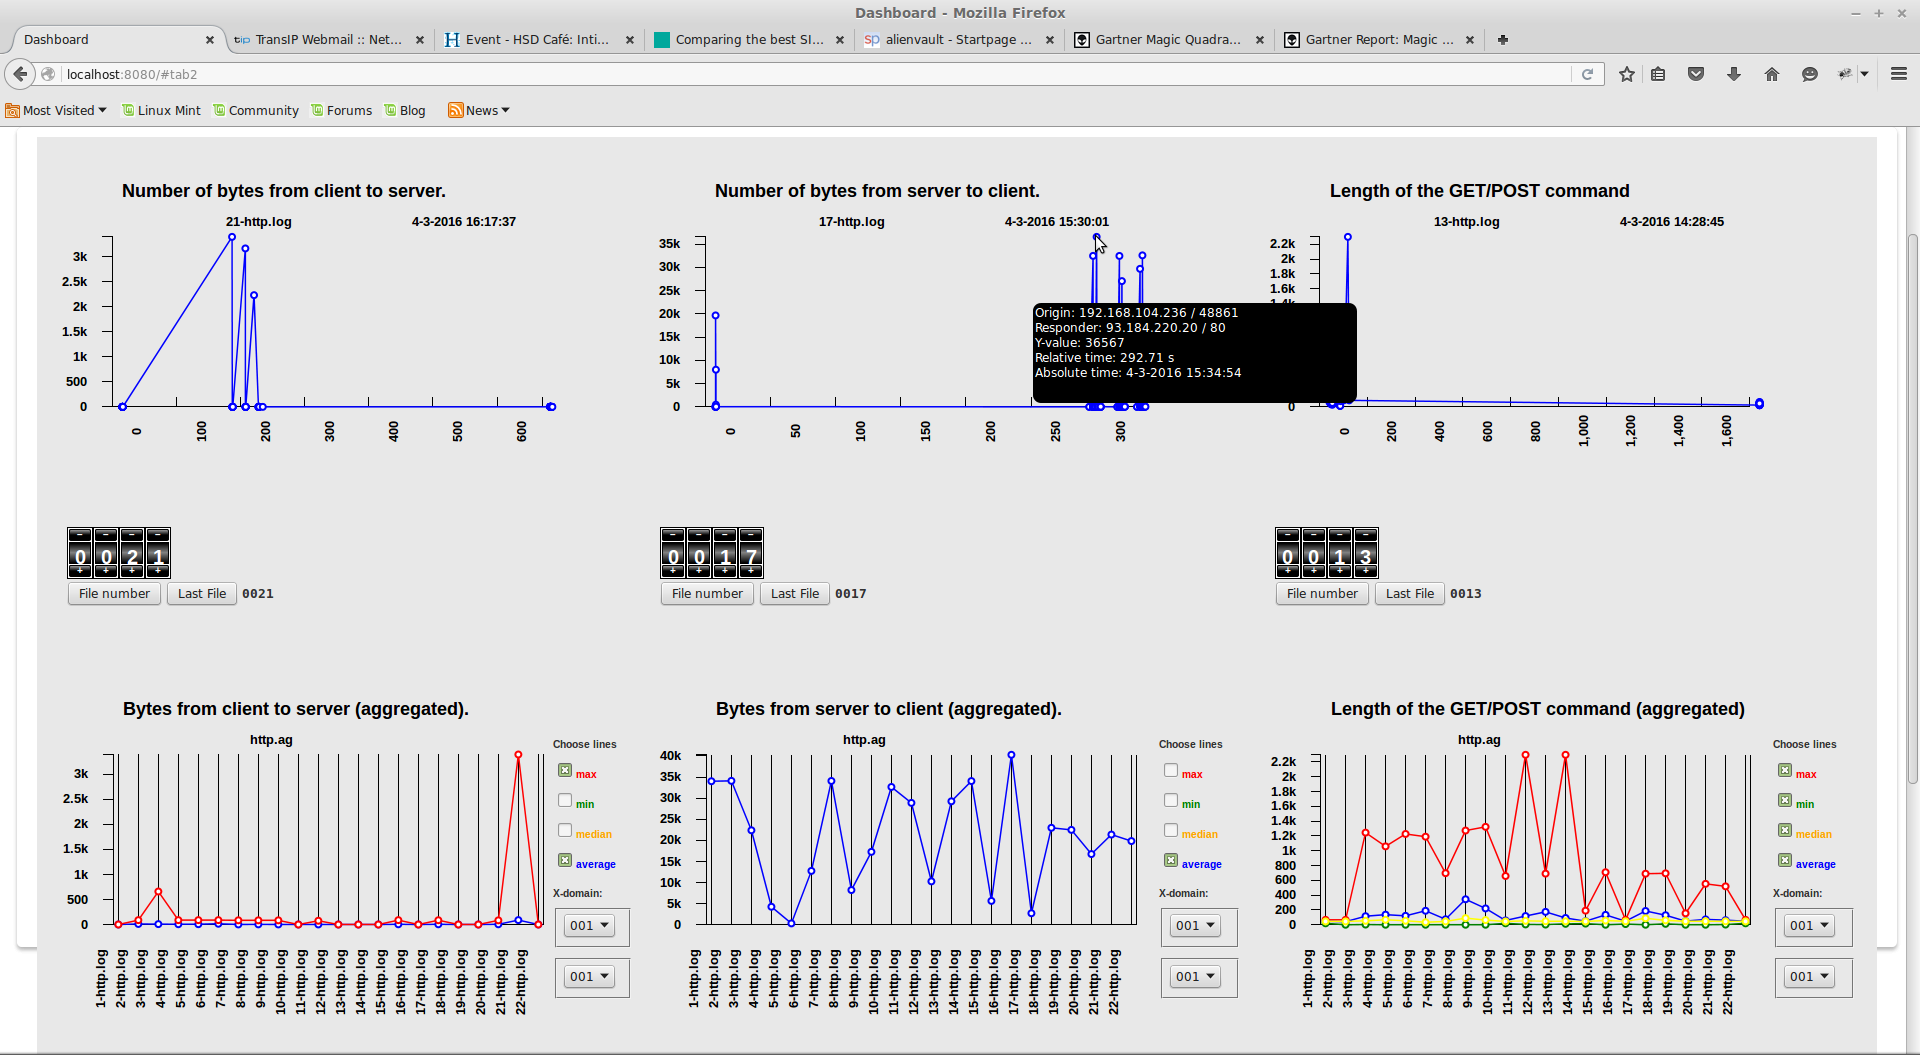
Secure Connection's Security dashboard provides a real time view of all events in the network. It provides a zoom function to view event details.
The data which displayed in the dashboard originates directly from Secure Connection's
Agents Framework
The security dashboard is a standard app of SecconBox.
The dashboard has several different views in teh various tabs.The upper row consists of different items per time frame, the lower row provides an aggregated of the displayed items over time view.
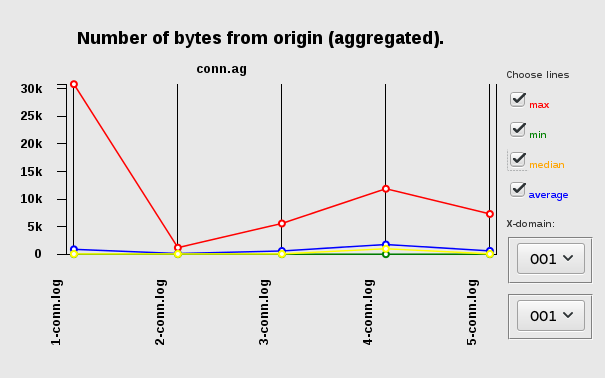
The aggregated data displays max-, min-, mean, and median values of the monitored items of every saved data set, i.e. the number of bytes from origin to responder.
Visualising events in a network
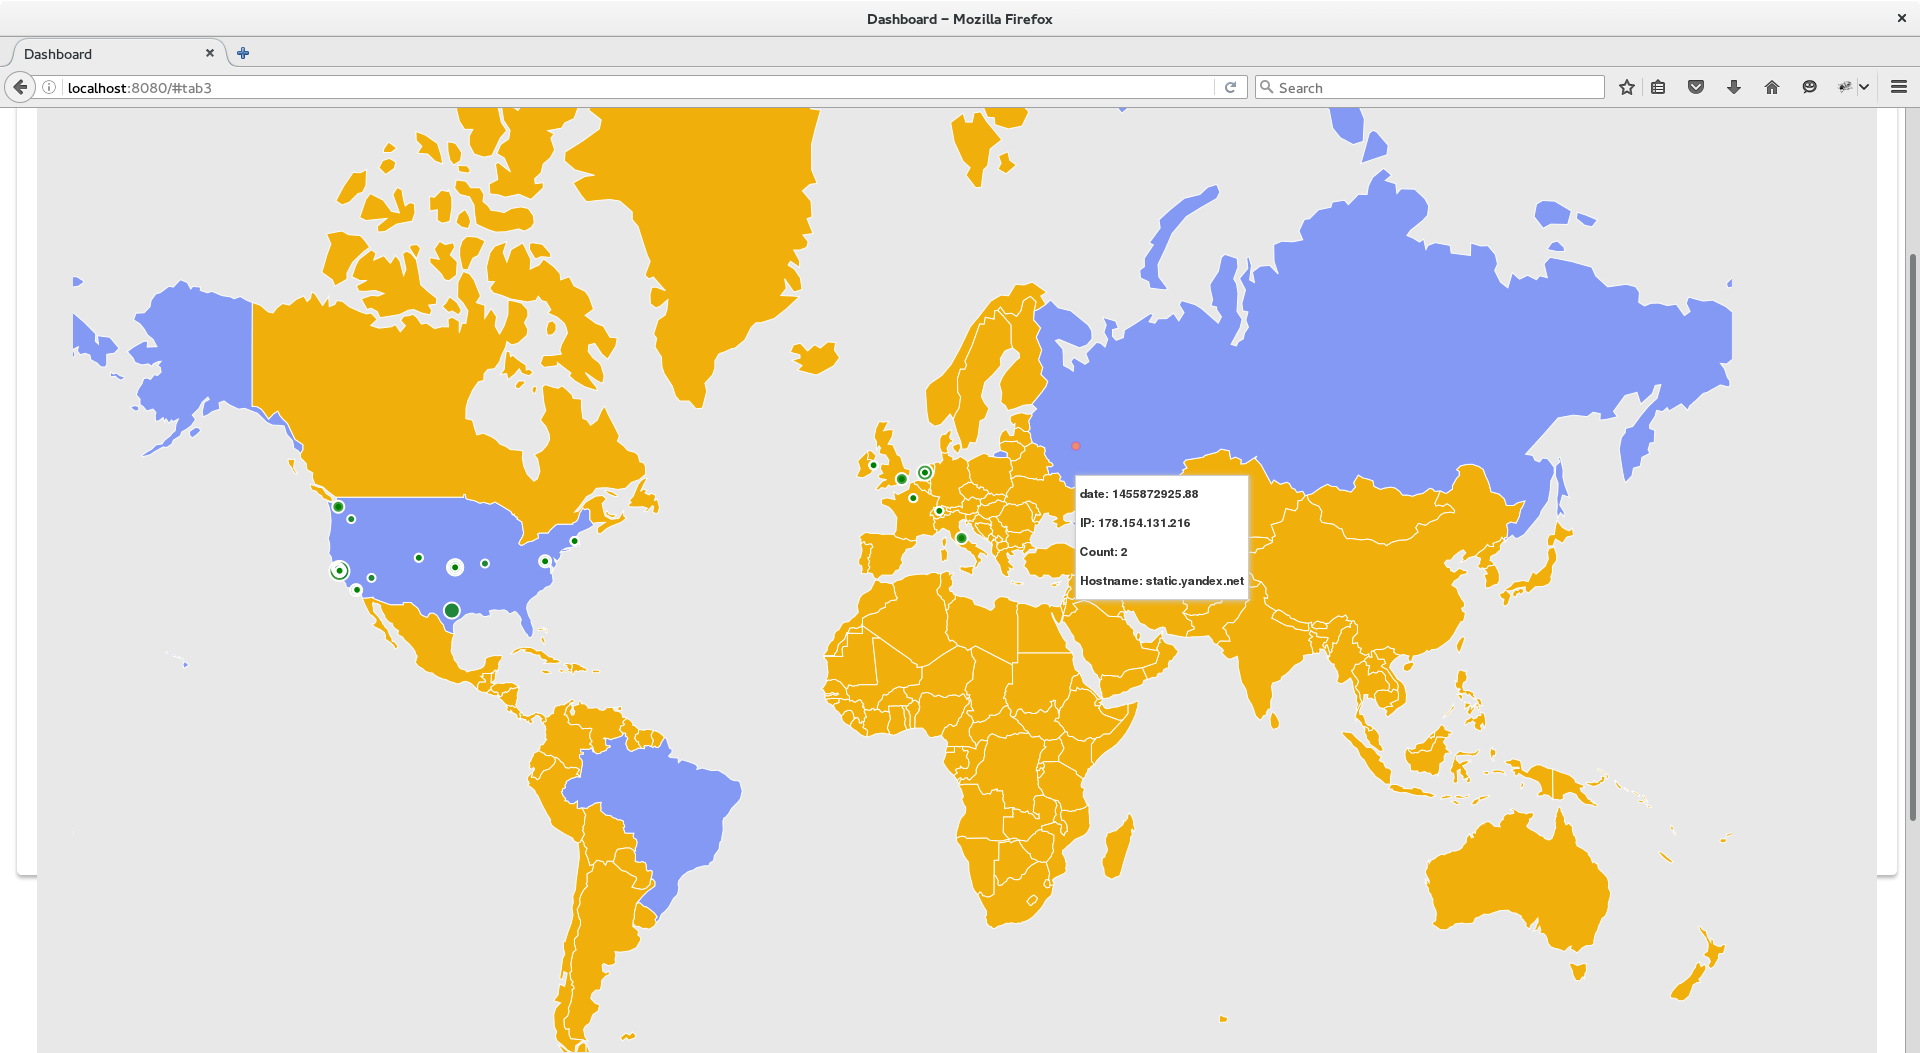
Geographical display of IP addresses
A special tab displays all external IP addresses with which there are connections. Possible malicious IP's are displayed in red on the map.
The size of the point is an indication of the extent of the communication. By clicking the point additional information about the IP address is provided.